# 01. 하이차트(HighcCharts) 마지막 컬럼 색상 변경 / 항목 색상 변경
😶 개발 하면서 최신값만 색상을 변경해야 하는 경우가 있었다. css로 해도 되나 여건 상 그렇게 작업을 해주시지 못하게 돼서 차트 옵션으로 해결해보았다.
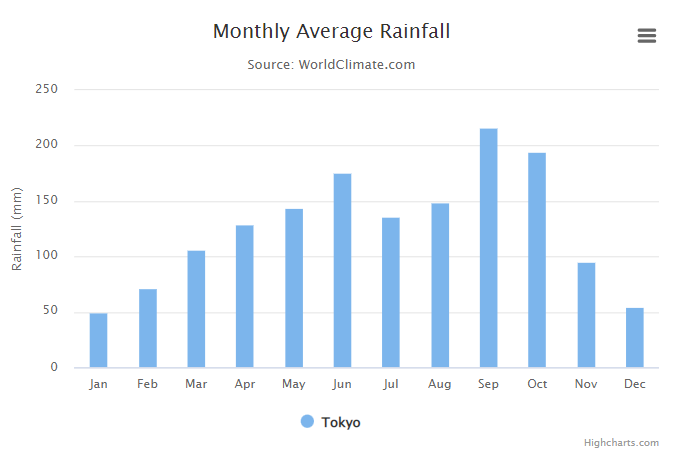
아래 이미지는 하이차트에 기본으로 있는 JSFiddle 예제이다.
아래와 같이 최신값만 색상을 변경하고, border처리 하였다. label에도 파란색을 입혀줬다.
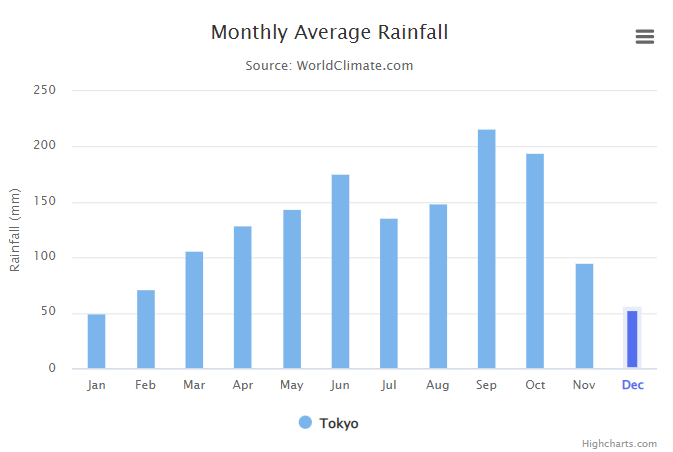
label의 경우, null이나 0값 처리를 안하면 formatter에서 isLast가 true일 경우에 update만 해줘도 된다.
xAxis: {
        categories: categories,
        crosshair: true,
        labels: {
        formatter: function() {
        	// xAxis labels 색상 변경 - 0 혹은 null 체크 안 할 경우
          if (this.isLast) {
            return `<b style="color: ${COLOR_BLUE}">${this.value}</b>`;
          } else {
            return this.value;
          }
        },
      },
  },
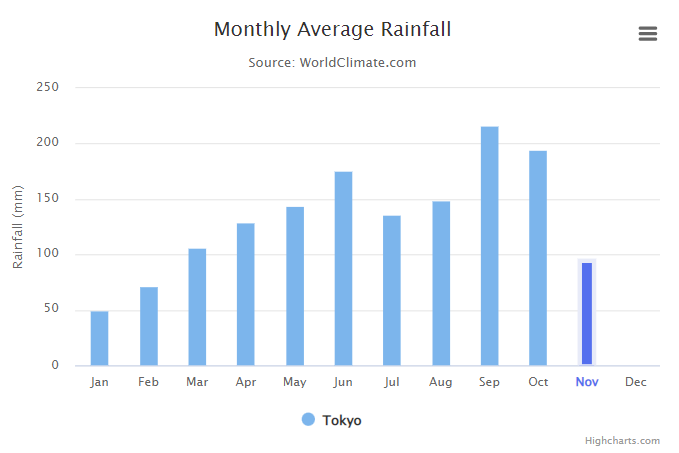
나같은 경우에는 null이나 0이 아닌 경우에만 색상을 변경해야 해서 가장 마지막 data부터 1씩 빼줘가면서 해결했다. 코드는 하단에 chart events 부분을 보면 된다.
(아래와 같이 마지막 데이터가 0인경우.. 아래 코드 클릭 시, JSFiddle로 이동된다.)
# 코드 (opens new window)
const COLOR_BLUE = '#546fee';
const COLOR_SKY = '#e8ebf8'
const categories = [
            'Jan',
            'Feb',
            'Mar',
            'Apr',
            'May',
            'Jun',
            'Jul',
            'Aug',
            'Sep',
            'Oct',
            'Nov',
            'Dec'
        ];

Highcharts.chart('container', {
    chart: {
        type: 'column',
        events: {
            load: function() {
              let chart = this,
                data = chart.series[0].data;

              // 가장 최근 데이터 색상 변경
              let length = chart.series[0].data.length,
                idx = 1;
              while (idx <= length) {
                if (!data[length - idx].isNull && data[length - idx].y != 0) {
                  // column 색상 변경
                  data[length - idx].update({
                    color: COLOR_BLUE,
                    borderColor: COLOR_SKY,
                    borderWidth: 4,
                    pointWidth: 13,
                  });
                  // xAxis labels 색상 변경 - 0 혹은 null 체크 할 경우
                    chart.xAxis[0].update({
                      labels: {
                        formatter: function() {
                          if (data[length-idx].x == this.pos) {
                            return `<b style="color: ${COLOR_BLUE}">${this.value}</b>`;
                          } else {
                            return this.value;
                          }
                        },
                      },
                    });
                  break;
                } else {
                  idx++;
                }
              }
            },
          },
    },
    title: {
        text: 'Monthly Average Rainfall'
    },
    subtitle: {
        text: 'Source: WorldClimate.com'
    },
    xAxis: {
        categories: categories,
        crosshair: true,
        labels: {
          formatter: function() {
          	// xAxis labels 색상 변경 - 0 혹은 null 체크 안 할 경우
            if (this.isLast) {
              return `<b style="color: ${COLOR_BLUE}">${this.value}</b>`;
            } else {
              return this.value;
            }
          },
        },
    },
    yAxis: {
        min: 0,
        title: {
            text: 'Rainfall (mm)'
        }
    },
    tooltip: {
        headerFormat: '<span style="font-size:10px">{point.key}</span><table>',
        pointFormat: '<tr><td style="color:{series.color};padding:0">{series.name}: </td>' +
            '<td style="padding:0"><b>{point.y:.1f} mm</b></td></tr>',
        footerFormat: '</table>',
        shared: true,
        useHTML: true
    },
    plotOptions: {
        column: {
            pointPadding: 0.2,
            borderWidth: 0
        }
    },
    series: [{
        name: 'Tokyo',
        data: [49.9, 71.5, 106.4, 129.2, 144.0, 176.0, 135.6, 148.5, 216.4, 194.1, 95.6, 0]

    }]
});